In-Depth Guide To The Volume Profile Indicator
This comprehensive guide will help you understand volume profile and how to use it. We will look at its key elements and how to integrate it into your trading strategy. How to use it for trade entries and exits, identify support and resistance levels, and reveal hidden buying and selling pressure. So, let's take a look at how it works.
What is Volume Profile
It order to understand Volume Profile, it's essential to distinguish it from Market Profile. Both are techniques for analyzing market data, but they differ in their approach. Market Profile is based on Time Price Opportunity (TPO) charts, which display price distribution over time. TPO charts help you identify areas where the market has spent the most time, indicating potential support and resistance levels. On the other hand, Volume Profile focuses on the distribution of traded volume at specific price levels, using Volume at Price (VAP) charts. VAP charts provide insights into areas with the highest trading activity, which can reveal significant price levels and market sentiment.
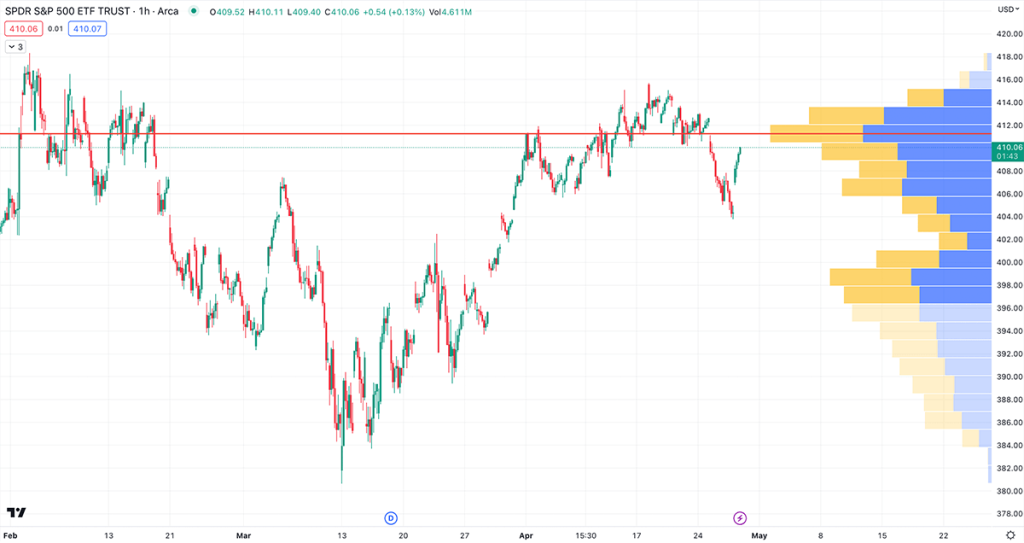
When a Volume Profile indicator is applied to a chart it looks like a series of horizontal bars plotted on the vertical price axis, illustrating the volume distribution at various price levels. These bars indicate the total amount of traded volume at each price level during a specified period. The length of the bars represents the volume concentration, with longer bars signifying higher trading activity and shorter bars indicating lower activity. By examining the Volume Profile on a chart, you can easily identify areas of high and low trading volume, which can help you determine potential support and resistance levels, gauge market sentiment, and make more informed trading decisions.
The key components of Volume Profile include Volume Nodes and Value Area. Volume Nodes refer to the areas where trading activity is concentrated, and they are divided into High Volume Nodes (HVN) and Low Volume Nodes (LVN). HVNs represent price levels with substantial trading volume, often acting as strong support or resistance levels. Conversely, LVNs indicate price levels with minimal trading volume, which can signify potential price reversals or breakouts. The Value Area, on the other hand, consists of the price range where a specific percentage of the total traded volume occurs, usually between 70% and 80%. The upper limit of the Value Area is called Value Area High (VAH), while the lower limit is referred to as Value Area Low (VAL). These levels can serve as potential entry and exit points for trades.
Types of Volume Profile Charts
Composite Volume Profile
- Displays the volume distribution within a single trading day, ideal for short-term price fluctuations.
Intraday Volume Profile
- Aggregates volume data over an extended period, offering a comprehensive view of market behavior for long-term analysis.
Fixed Range Volume Profile
- Focuses on a specific price range allowing for a detailed analysis of volume distribution within that range.
Session Volume Profile
- Covers multiple trading sessions, suitable for swing trading or those looking to analyze volume patterns over several days.
Custom Volume Profile
- Allows you to set parameters for the volume data, providing maximum flexibility in analyzing volume distribution.
How to Trade With Volume Profile
Trading with Volume Profile involves identifying specific setups based on areas of high and low trading volume, which can provide valuable insights for potential trade opportunities. One common setup to look for is the breakouts or reversals around Low Volume Nodes (LVNs). Since LVNs represent price levels with minimal trading activity, they often act as areas of weak support or resistance. When the price approaches an LVN, you can anticipate a potential breakout or reversal, depending on the prevailing market trend and sentiment.
Another useful setup involves trading around High Volume Nodes (HVN) and the Value Area (VA). HVNs signify strong support or resistance levels, while the Value Area represents the price range where the majority of trading activity occurs. When the price is within the Value Area, it often indicates a balanced market condition, and you can look for opportunities when the price moves towards the Value Area High (VAH) or Value Area Low (VAL). For instance, if the price is near VAH and shows signs of rejection or reversal, you can consider taking a short position. Conversely, if the price approaches VAL and exhibits support or reversal patterns, you can initiate a long position.
Conclusion
Volume Profile is a powerful tool that can provide insights into the distribution of traded volume at specific price levels. By understanding its key components, such as High Volume Nodes, Low Volume Nodes, and the Value Area, you can identify potential support and resistance levels, anticipate breakouts or reversals, and optimize your trade entries and exits.